Complex model visualization with Aven, Loch, KML and Compass

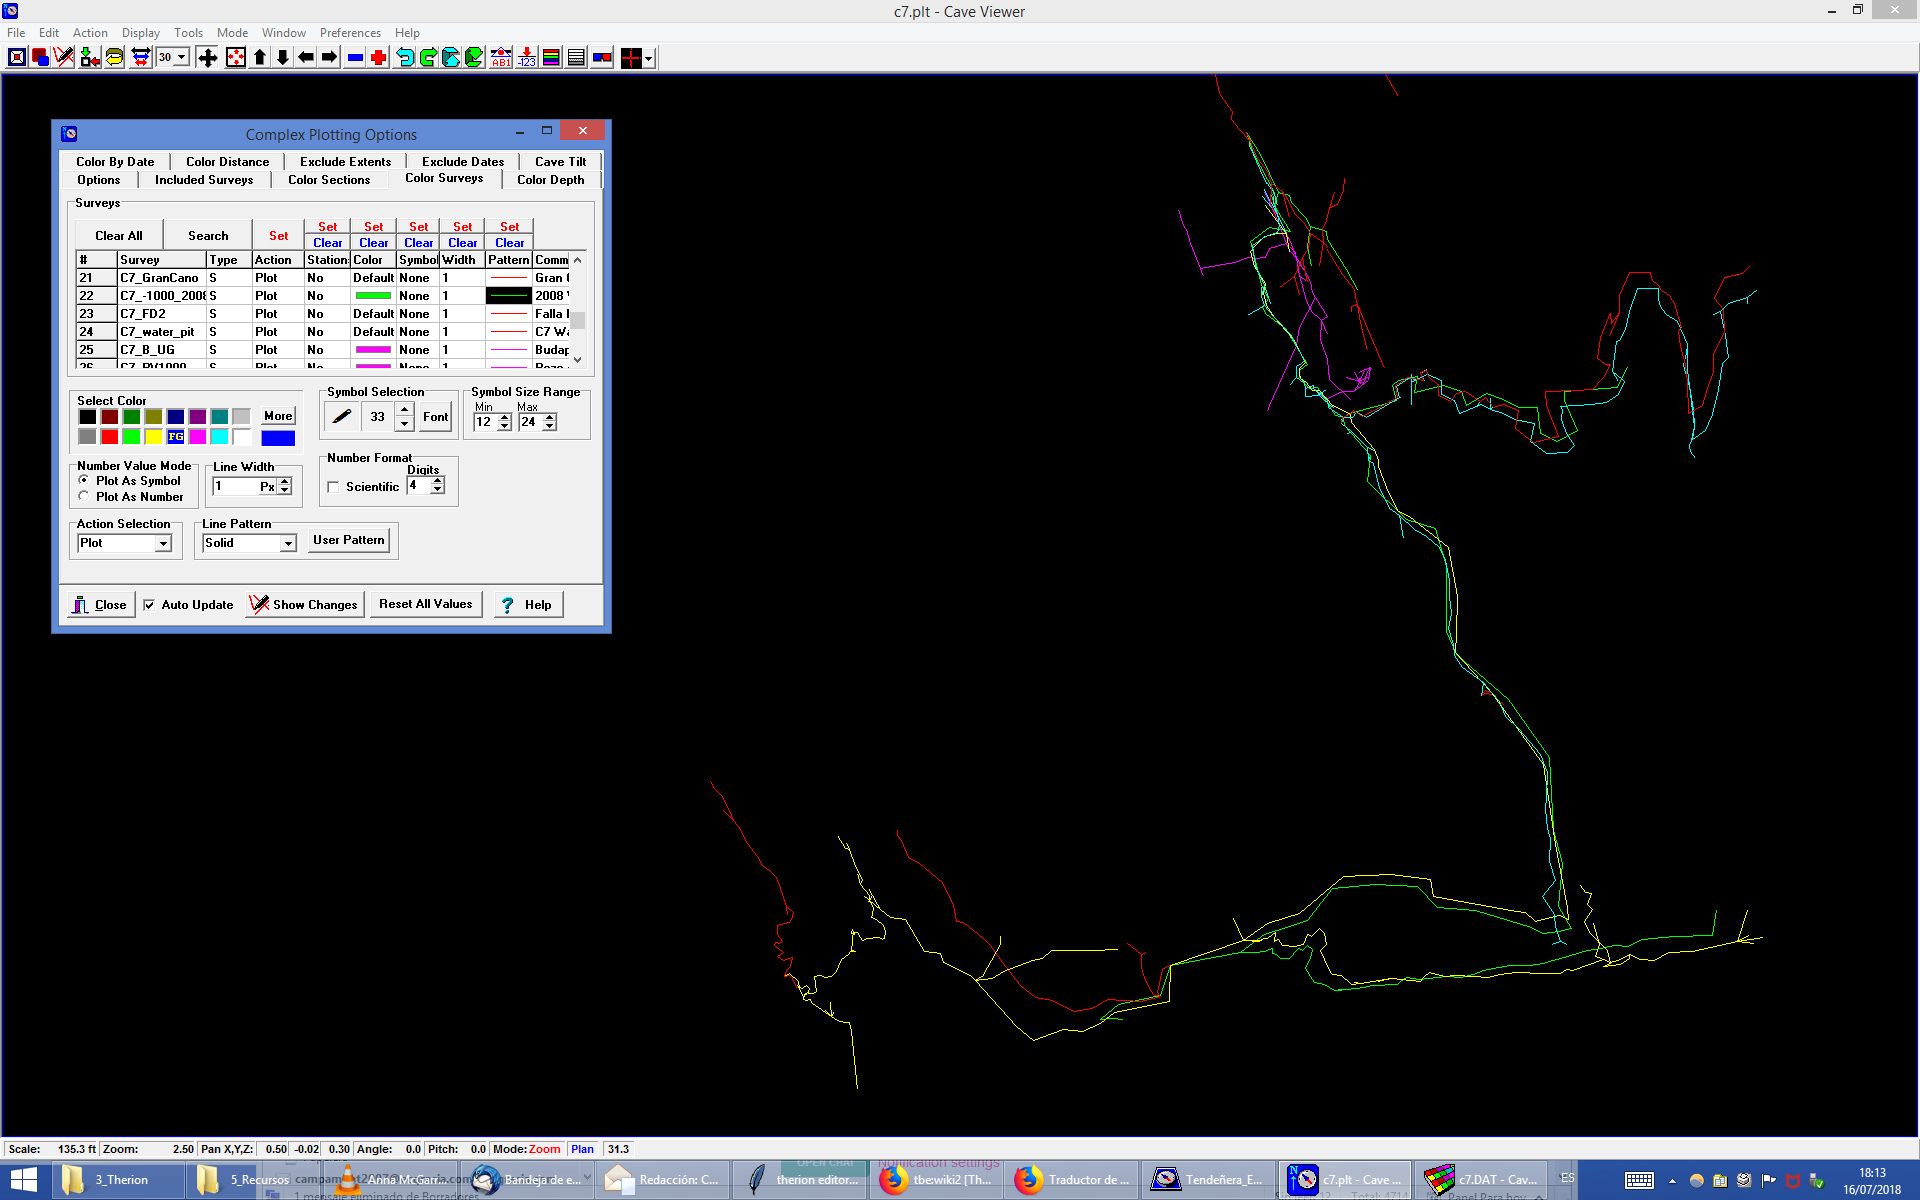
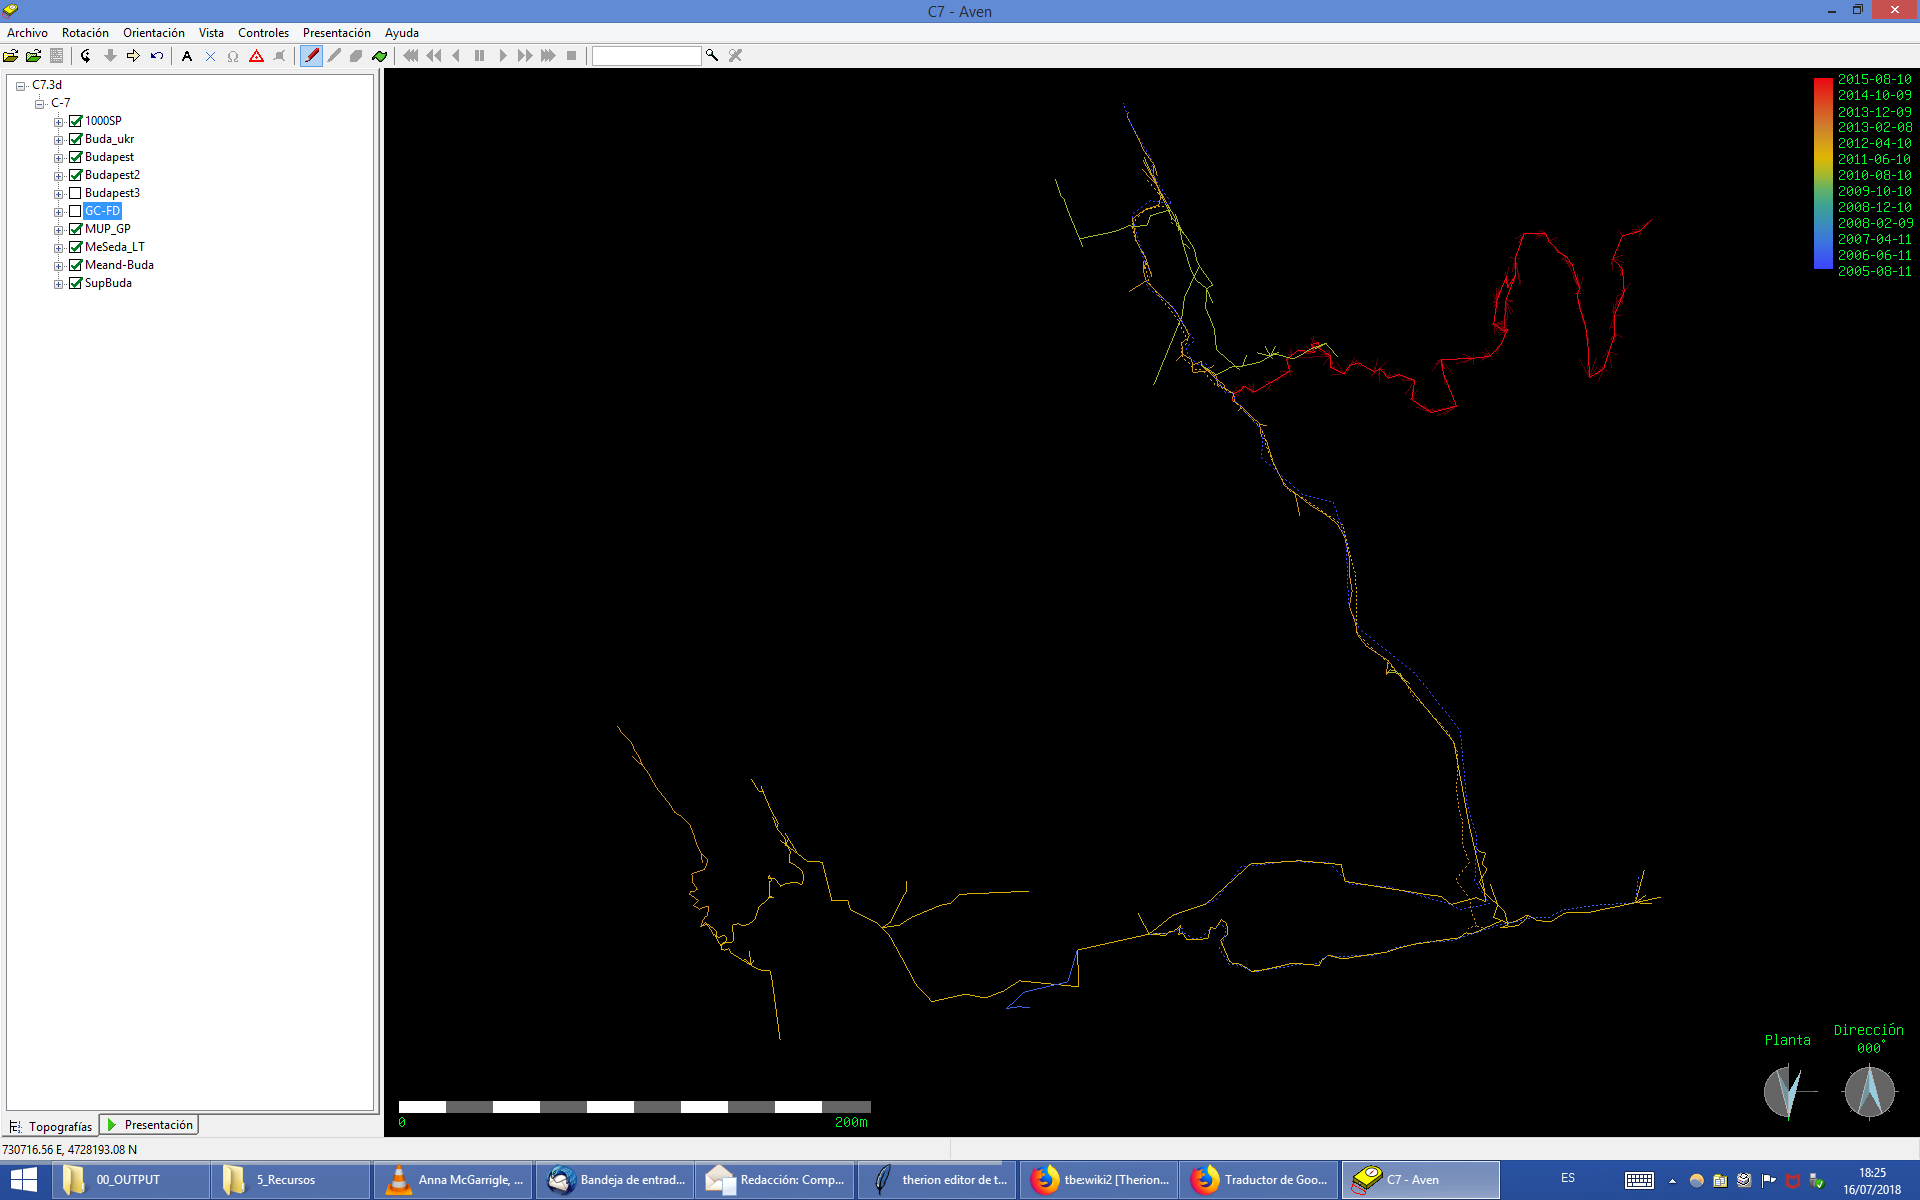
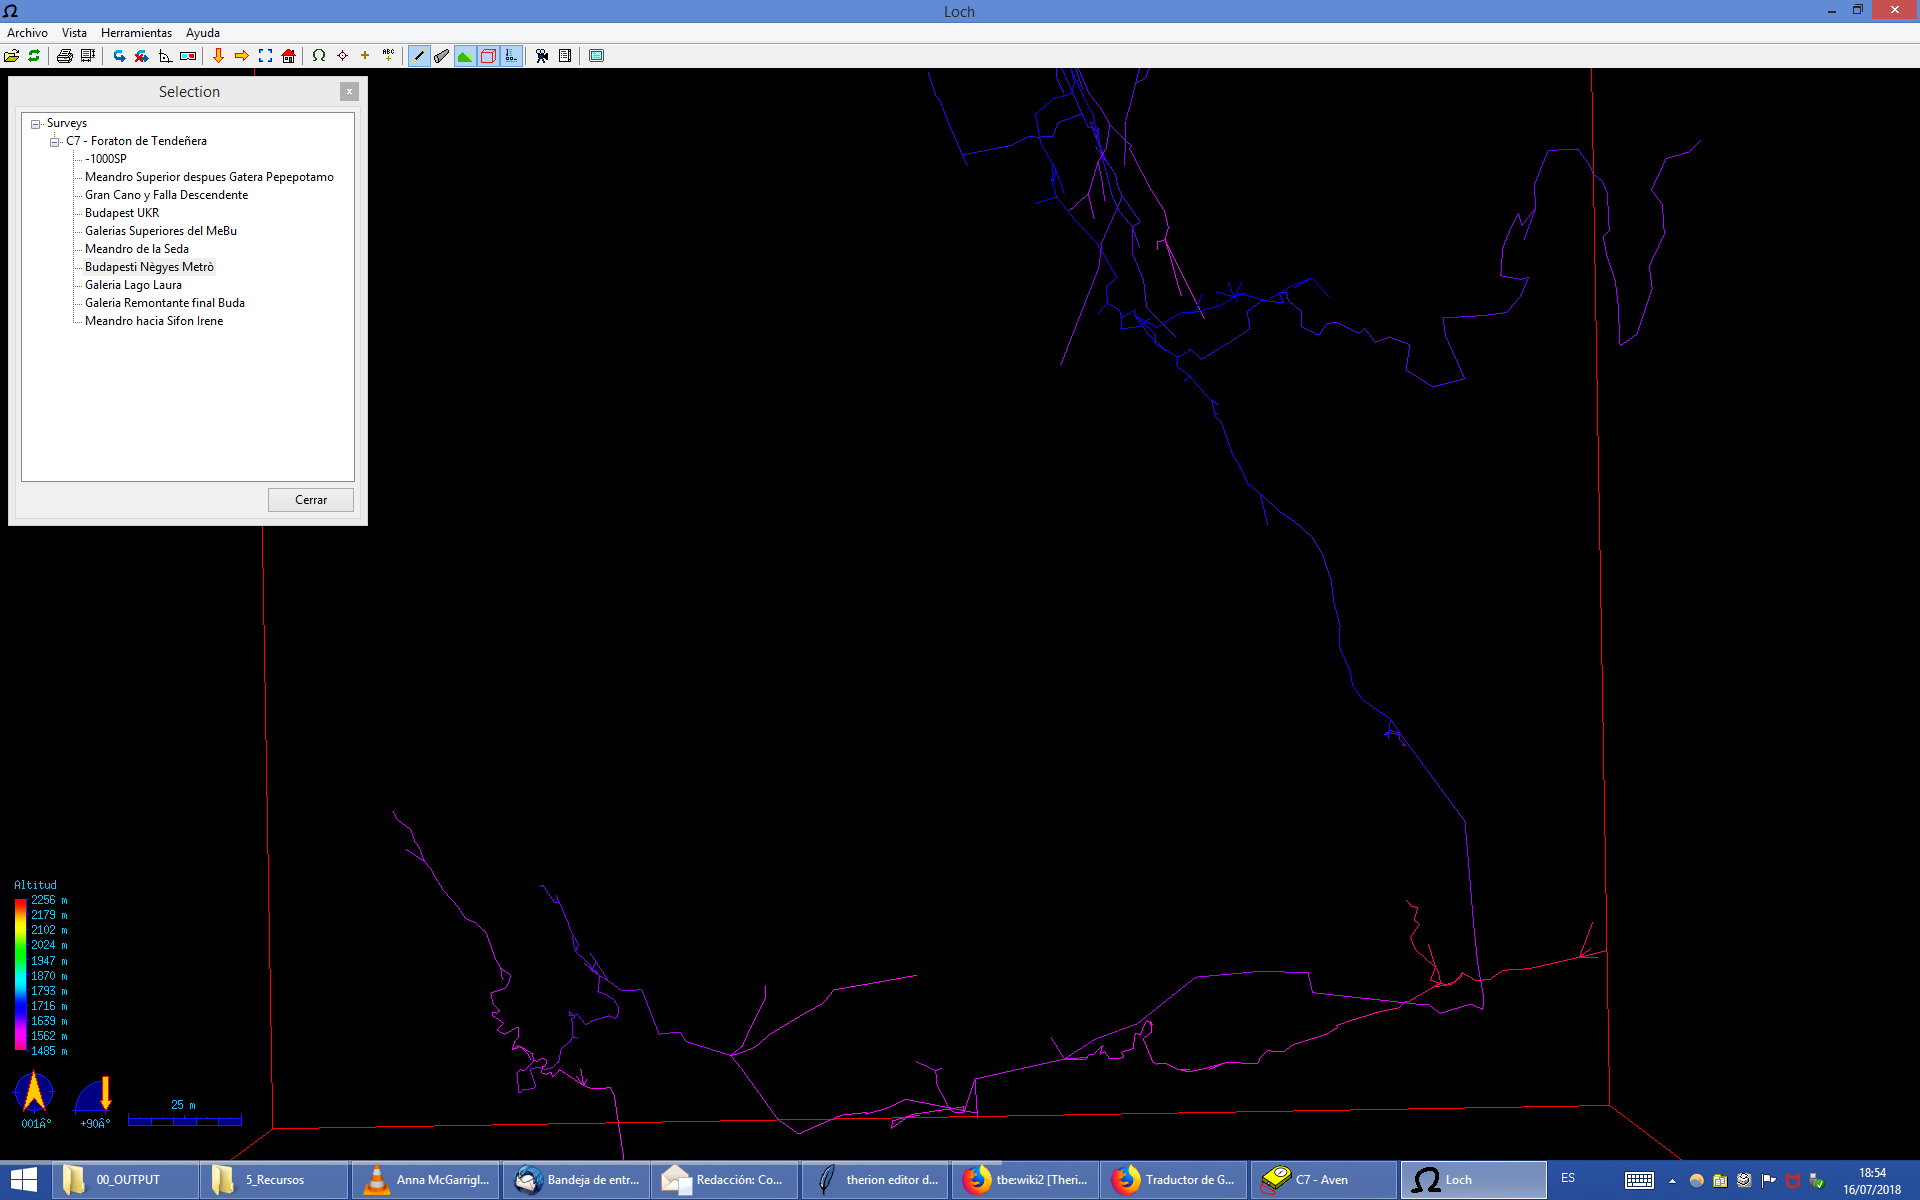
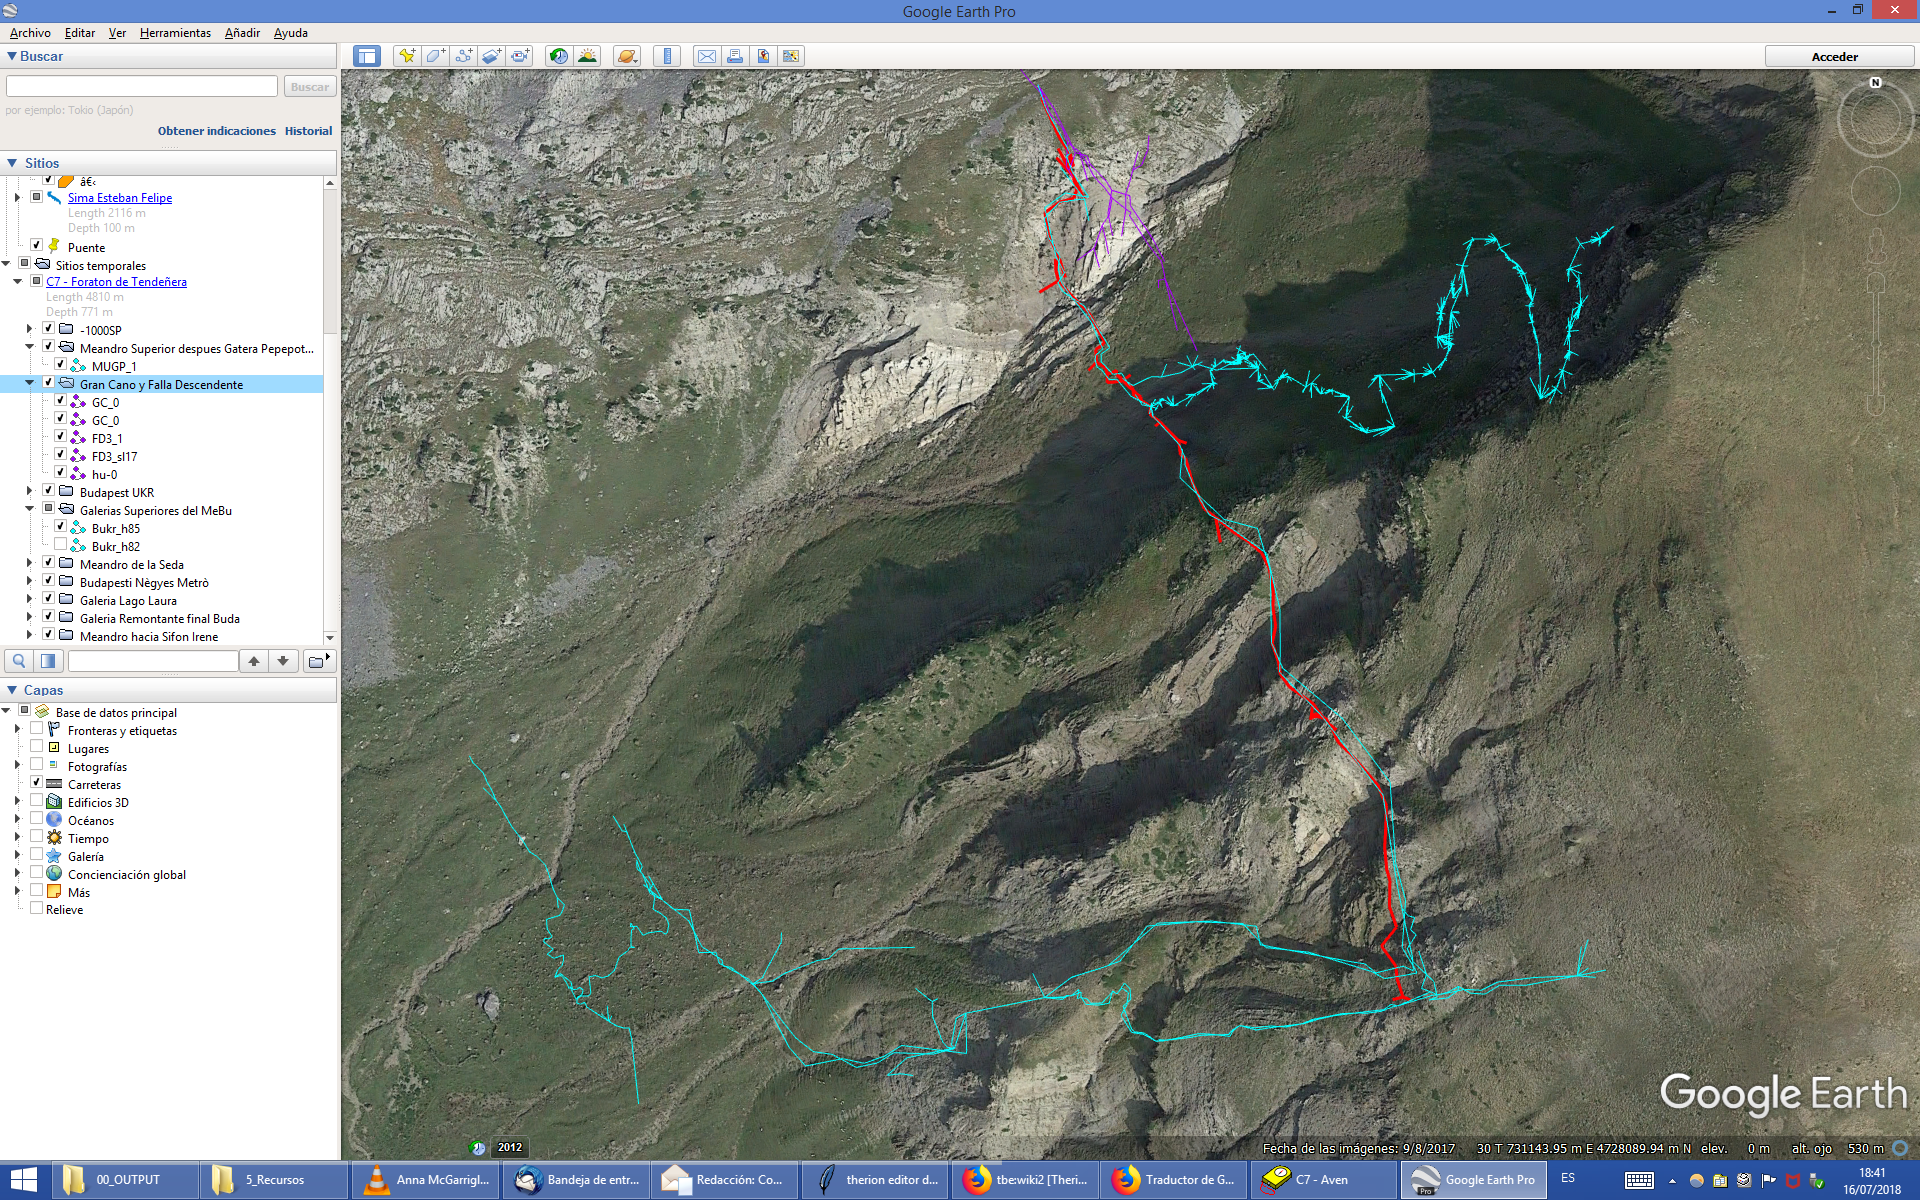
Hi, I have been a Lary Fish Compass user for almost 20 years. One of the reasons for having been so loyal to the program is its powerful visualizers (Cave Viewer and CaveXO); and at a time when the data was entered by hand its powerful data editor (Cave Editor). In Compass there are 2 basic types of concepts: "Surveys" assimilable to the Therion "Centerlines" and "Section", used normally to define Caves or caves parts like Therion "Surveys". With the "Complex Plotting Options" menu of the "Cave Viewer", I can show, hide, color, symbol, etc, of the centerlines and walls by section, surveys, dates and distances. It's a very powerful tool to analyses complex caves systems. The Compass PLT exported by Therion don't have the data structured by Compass "Surveys" and "Sections"; so I lose the ability to use the complex visualization options. Aven is a very powerful tool too. I like the easy and intuitive rotation controls and Error visualization. I can show/hide Therion surveys. But a can't show/hide the "Centerlines". All my centerlines have "id" and "title". I can't choose a color by survey. I can show/hide duplicate shots. I can colorize by depth, date, error, slope and lenght. Loch, the Therion visualizer. It's a funny tool. I like the 3D walls using the scraps walls. I can colorize only by depth and default. I don't know if I can show/hide the the different surveys. The Selection Menu is only informative, or you can play with it? . I can show/hide duplicate centerline shots, but I can hide duplicate shots walls (see an other post). Therion export models to KML, and I can use Google Earth to visualize it. With Google Earth I can show/hide the surveys and centerlines (Therion don't export the id or title, but I can recognize the name of the first station. I can change color and style to surveys and centerlines. I can't view in 3d underground. I am now an enthusiast of Therion/Survex and its derivative products: complex loop closure with weighting SD error by centerlines quality, sketch morphing, complete map creation, semantic symbology, automatic scraps warps when the centerline change, etc. That is why new projects are currently with Therion, and I am transferring from Compass the data of our jewel in the crown: Sistema Arañonera. Now, as a basic and quick model analysis tool, I use Aven. Loch uses it for some 3d walls representation. But done to miss some Compass complex visualization for analysis of complicated systems. Ideally, for me, Therion would export PLT with a Compass "surveys" and "sections" structure, so I could use the best of both worlds. Best Regards, Evaristo.

Evaristo, as I know you may do the same by definition of different maps. Not interactive. There are many other possibilities like <debug on> in output etc. Martin
16. 7. 2018 v 19:20, Evaristo Quiroga via Therion <therion@speleo.sk>:
I have been a Lary Fish Compass user for almost 20 years. One of the reasons for having been so loyal to the program is its powerful visualizers (Cave Viewer and CaveXO); and at a time when the data was entered by hand its powerful data editor (Cave Editor).
In Compass there are 2 basic types of concepts: "Surveys" assimilable to the Therion "Centerlines" and "Section", used normally to define Caves or caves parts like Therion "Surveys".
With the "Complex Plotting Options" menu of the "Cave Viewer", I can show, hide, color, symbol, etc, of the centerlines and walls by section, surveys, dates and distances. It's a very powerful tool to analyses complex caves systems.

On 2018-07-16 19:20 +0200, Evaristo Quiroga via Therion wrote:
Aven is a very powerful tool too. I like the easy and intuitive rotation controls and Error visualization. I can show/hide Therion surveys. But a can't show/hide the "Centerlines".
You can show/hide centrelines. Presumably you mean you can only hide all or none? Last year it gained 'hide all but this one' feature, and just last week it gained 'show/hide each individual survey'. Does that help? (it certainly helps us)
All my centerlines have "id" and "title". I can't choose a color by survey.
You mean that you want to be able to 'display survey foo in <choose colour>'? Or display title in colour <choose>? Or something else? Wookey -- Principal hats: Linaro, Debian, Wookware, ARM http://wookware.org/

On Mon, Jul 16, 2018 at 10:37:45PM +0100, Wookey via Therion wrote:
On 2018-07-16 19:20 +0200, Evaristo Quiroga via Therion wrote:
Aven is a very powerful tool too. I like the easy and intuitive rotation controls and Error visualization. I can show/hide Therion surveys. But a can't show/hide the "Centerlines".
You can show/hide centrelines. Presumably you mean you can only hide all or none? Last year it gained 'hide all but this one' feature, and just last week it gained 'show/hide each individual survey'.
"Hide others" was actually added in 2016 (and the ability to show individual surveys was the week before last!)
All my centerlines have "id" and "title". I can't choose a color by survey.
You mean that you want to be able to 'display survey foo in <choose colour>'? Or display title in colour <choose>? Or something else?
"Colour by Survey" would be easier now thanks to the changes needed to allow showing individual surveys. Generally speaking, if there's a feature you feel would be useful to add to Survex, open a ticket for it on https://trac.survex.com/ if there isn't one already, or comment on an existing ticket (you'll need to create an account there first). Otherwise you're relying on me thinking of it myself, or someone else getting around to proposing it. If you're able to code it up yourself, even better. Cheers, Olly
participants (4)
-
 Evaristo Quiroga
-
 Martin Sluka
-
 Olly Betts
-
 Wookey