extend of nosurvey legs not always rendered

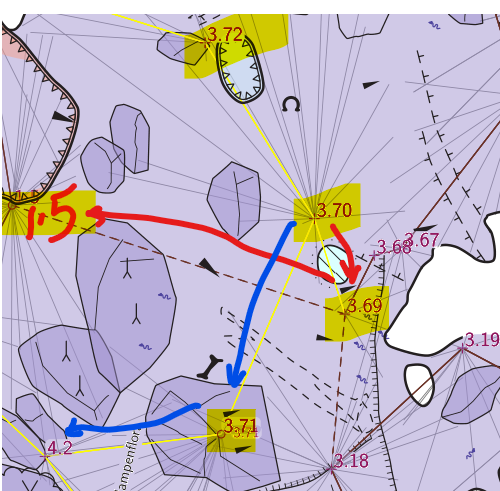
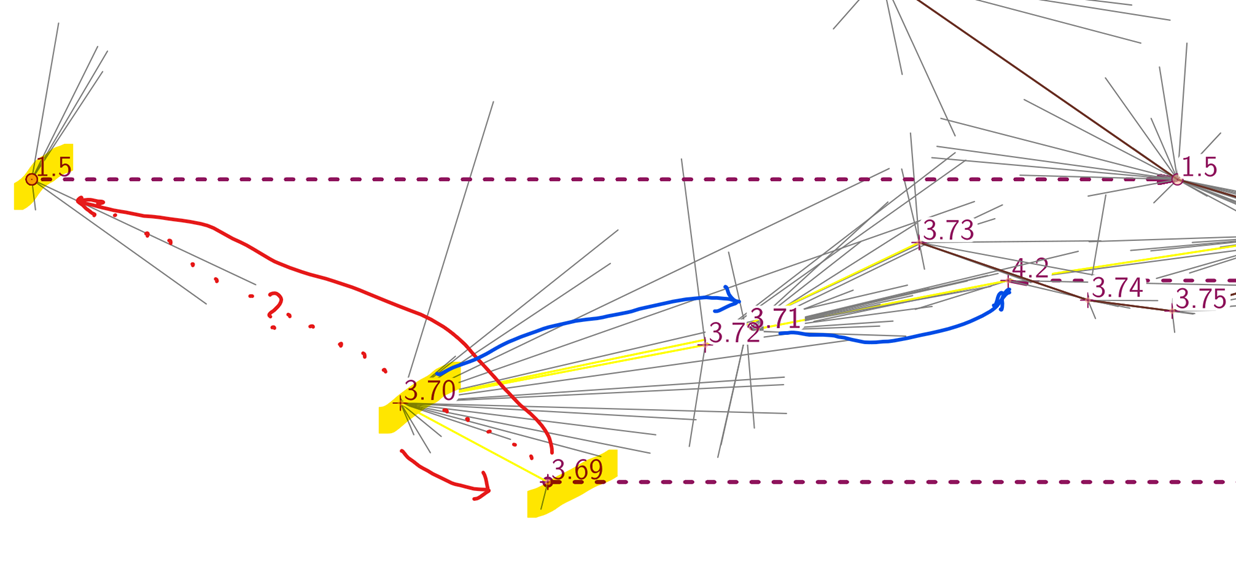
Stacho (you might have best insight into this) I'm working on a small but slightly complicated plan and extended elevation, 876 m of survey and 9 loops, plus additional loops created using nosurvey legs. I have been making slow progress, but resolving the centreline extension across some of the loop connections has been eluding me. I think in part it is because the nosurvey legs are not always rendered in extended elevations. In the screenshots and transcript below, 3.70 right to 3.69 is rendered in the extended elevation, but not 3.69 left to 1.5. It is exactly as though there is an 'extend hide 3.69 1.5' statement in there, in fact I tried adding that, and it made no difference at all (not that that proves anything). I have purged all 'extend hide' statements from the dataset, and at least some of the other nosurvey legs are rendered correctly when I do that. In the plan view below; * Survey legs are shown in yellow and brown - yellow for flags 'duplicate', brown for flags 'not duplicate' (not many of those in this image) * dashed survey legs are flagged 'approximate' (because they are nosurvey legs, this is how I distinguish them pictorially for debugging purposes) Here is part of the log extend transcript: START 3.75@3.Hawkes START 3.72@3.Hawkes START 3.78@3.Hawkes START 3.79@3.Hawkes START 3.70@3.Hawkes RIGHT 3.69@3.Hawkes LEFT 1.5@1.Hawkes BACK 3.69@3.Hawkes BACK 3.70@3.Hawkes RIGHT 3.71@4.Hawkes RIGHT 4.2@4.Hawkes So, is it possible that nosurvey legs are not reliably plotted in extended elevations? Or is it likely that I have some other problem here? Bruce
participants (1)
-
 Bruce Mutton